This is a follow-up to my earlier post: Employment Along the Canada-U.S. Border. In that post, I reported employment ratios and participation rates for three regions: Canada, U.S. states that bordered Canada, and U.S. states that did not border Canada. The main conclusion was that U.S. border states behave a lot more like non-border states, than they do Canada.
In this post, I (well, my fine research assistant, Lily, actually) report the same data but controlling for age and sex. In particular, I restrict attention to "prime age" workers--the age range 25-54 years old. I also divide the groups by sex. Here is what we get.
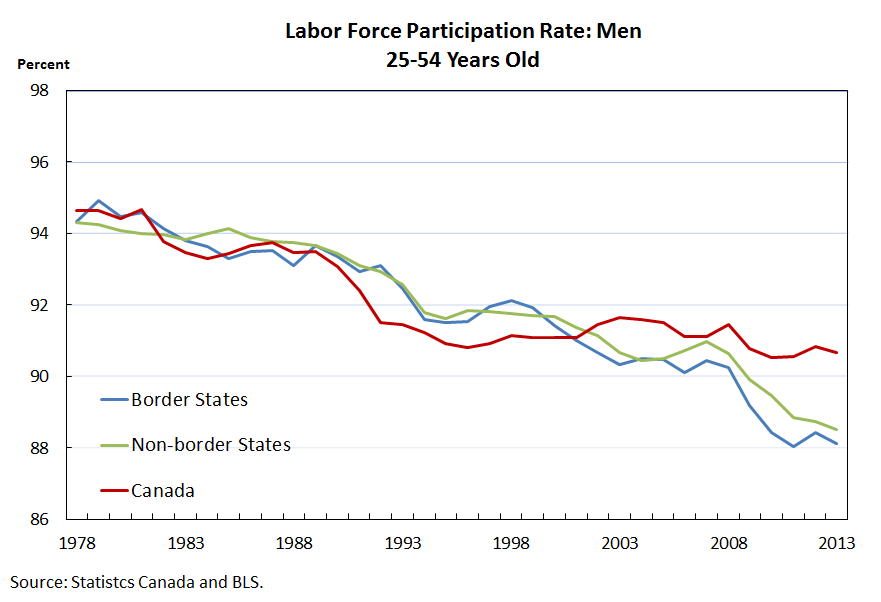 Participation rates for prime-age males has been declining steadily over time, but the decline seems to be much more dramatic in the U.S. Again, the border states follow their southern, rather than northern, counterparts.

The declining participation rates among men have been offset in part by the rising participation rates among prime-age women. Since about 2000, the participation rate among Canadian prime-age women continues to rise and remain stable, while in the U.S., the participation rate declines a bit. Again, the border states look more like their southern counterparts.

The great Canadian slump is evident in the 1990s. By the early 2000s, the employment to population ratio of prime-age males in both countries were roughly the same. The most recent recession hit the U.S. more severely than in Canada. Again, note that the border states followed their U.S. counterparts more closely than their Canadian neighbors.

According to this data, Canadian prime-age women were hardly affected by the recent recession.The pattern here is similar to the labor force participation rates described above.
While we can't say for sure just by looking at this data, I suspect that national policy differences are driving much of the different behavior here. But before I start looking for what these policy differences might be, I'll ask my trusty R.A. to look at sectoral decompositions.
In this post, I (well, my fine research assistant, Lily, actually) report the same data but controlling for age and sex. In particular, I restrict attention to "prime age" workers--the age range 25-54 years old. I also divide the groups by sex. Here is what we get.
The declining participation rates among men have been offset in part by the rising participation rates among prime-age women. Since about 2000, the participation rate among Canadian prime-age women continues to rise and remain stable, while in the U.S., the participation rate declines a bit. Again, the border states look more like their southern counterparts.
The great Canadian slump is evident in the 1990s. By the early 2000s, the employment to population ratio of prime-age males in both countries were roughly the same. The most recent recession hit the U.S. more severely than in Canada. Again, note that the border states followed their U.S. counterparts more closely than their Canadian neighbors.
According to this data, Canadian prime-age women were hardly affected by the recent recession.The pattern here is similar to the labor force participation rates described above.
While we can't say for sure just by looking at this data, I suspect that national policy differences are driving much of the different behavior here. But before I start looking for what these policy differences might be, I'll ask my trusty R.A. to look at sectoral decompositions.